There are numerous options for determining the performance of pipelines running on your Azure Synapse Analytics dedicated SQL pool. Two that are very useful are Metrics and the Monitor hub Pipeline Runs page. Metrics related to Azure Synapse Analytics are available both for the workspace and for each dedicated SQL pool. From a workspace perspective, viewing the metrics for pipeline runs and activity runs can give you insights into how used the workspace is. For a more granular look, you can view metrics like active queries, CPU used percentage, DWU used percentage, memory used percentage, and queued queries, from a dedicated SQL pool perspective. Figure 9.2 illustrates a few of the stated metrics. These metrics can help you determine if the currently allocated compute resources are nearing the level of overutilization.
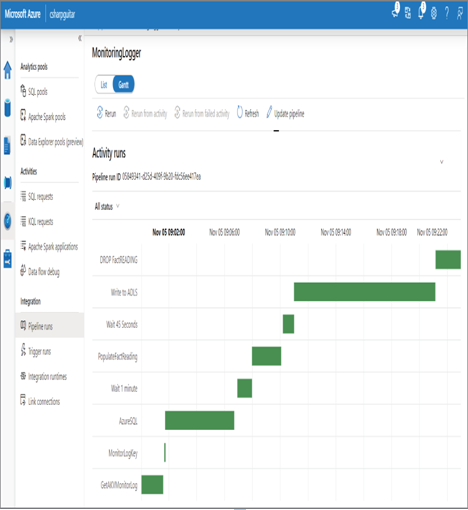
In Figure 9.10, you can see a column named Duration. This column identifies the amount of time the pipeline took to execute from start to end. Whether or not that duration is acceptable depends on what it does. If the amount of time appears to take longer than what you expect, you can drill down into a pipeline to view its activities, as shown in Figure 9.14. The default presentation of the activities is a list that also has an associated Duration value, the sum of which should equal the pipeline duration. You can also view the numerical values in the Duration column in Gantt format, as shown in Figure 9.22.

FIGURE 9.22 Monitoring data pipeline performance Gantt chart
It is easy to recognize which activities take the longest by looking at the times, but the chart makes it much easier to determine where most of the time is spent. Consider the activity named AzureSQL, for example. This is not the longest running activity, but perhaps it is expected to run much more quickly than it is. In Figure 9.15 you saw that you can drill into the data flow to see the different modifiers that are running within it. What you did not see is that you can also select each modifier to get even more details at that level. For example, that data flow is pulling all 4,537,353 rows of brain wave readings from an Azure SQL database hosted in the central US to a temporary dedicated SQL pool table hosted in central Germany. More analysis into that specifically would be required to determine if that is slow or fast.


