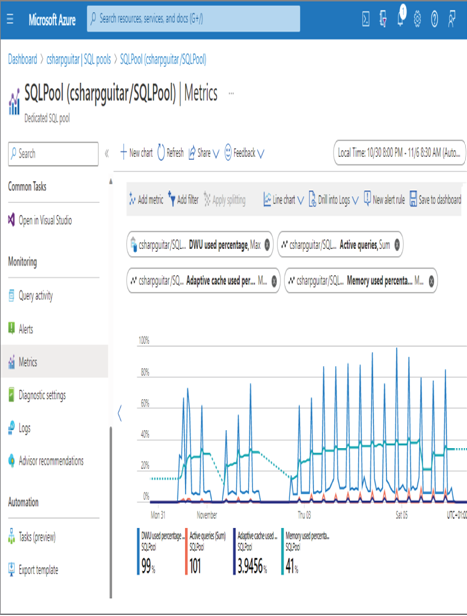
As shown in Figure 9.17, the DWU usage reached close to 100 percent on two occasions, and 41 percent of the memory was used. The performance level of the dedicated SQL pool named SQLPool is DW100c, which is the smallest available. When you see the usage of a DWU hitting 100 percent, it is a good sign that you need to increase its size. Remember that DWU is a combination of CPU percentage and data I/O percentage.

FIGURE 9.17 Azure Synapse Analytics dedicated SQL pool metrics
Another useful metric for measuring performance is the Adaptive Cache Used Percentage. When your data is cached in memory, a query does not need to access a data source or file, which is an I/O operation, to retrieve data. It is much faster to retrieve data from memory than from disk. Therefore, a cache hit value of 3.9 percent may not be optimal. If you need to improve performance, you can dig deeper into the active queries to determine if something can be done to improve caching. Apache Spark pools offer metrics on vCore and memory allocations. If you see that those values are nearing 100 percent, then an upgrade would be recommended. Refer to Table 9.3 for the different node sizes for Apache Spark pools. Some examples of data logged by the diagnostics settings targeting the Azure Synapse Analytics workspace include Synapse RBAC Operations, Built‐in Pool Requests Ended, and Integration Pipeline, Activity, and Trigger Runs. Targeting the storage of these diagnostics settings to a Log Analytics cluster, you can query the data using a query similar to the following:
SynapseIntegrationPipelineRuns
| project TimeGenerated, PipelineName, Annotations, OperationName, Level,
Status
| take 100
| order by TimeGenerated
The result of this query provides some insights into the status, result, and frequency of your pipeline runs. In isolation this data would provide a limited view of what is happening in your data analytics solution. Combining queries from multiple tables and across multiple products can result in great operational insights. For example, if a pipeline run fails, you can include data from the SynapseIntegrationActivityRuns table and the StorageBlobLogs table to see how the transaction flowed across products as well as tables.
The final topic for this section has to do with troubleshooting PolyBase issues. This is very often in the context of the serverless SQL pools and external tables. Numerous DMVs can be used and typically include the word external. A few of them are provided in Table 9.4.
TABLE 9.4 DMVs for troubleshooting PolyBase
| Name | Description |
| sys.dm_exec_external_work | Lists communications with external sources |
| sys.dm_exec_external_operations | Lists operational details about PolyBase |
| sys.external_tables | Lists external tables in the database |
| sys.external_data_sources | Lists external data sources in the database |
| sys.external_file_formats | Lists each external file format |
| sys.dm_exec_distributed_requests | Lists details about both the current PolyBase query and recent queries |
You can use the sys.dm_exec_distributed_requests DMV in a query to find the execution ID of the longest‐running query, as follows:
SELECT execution_id, est.text, edr.total_elapsed_time
FROM sys.dm_exec_distributed_requests edr
cross apply sys.dm_exec_sql_text(sql_handle) est
ORDER BY total_elapsed_time DESC;
The result comes in handy if you are experiencing performance issues related to PolyBase and external tables. The result will provide the ID of the query that is taking the longest. Then you can perform more analysis to find the steps and commands that are being optimized and find ways to improve them.


