- Log in to the Azure portal at https://portal.azure.com ➢ navigate to the Azure Synapse Analytics workspace you created in Exercise 3.3 ➢ select the pipeline you created to generate usage logs ➢ select the Properties icon (refer to Figure 6.68) ➢ enter an annotation (I used Monitoring) ➢ and then commit and publish the pipeline.
- After numerous pipeline trigger invocations, navigate to the Monitor hub ➢ select Pipeline Runs from the Integration section ➢ choose the Edit Columns menu item ➢ move the Annotations column to the second position ➢ and then click OK.
- Click the Add Filter button ➢ select Annotations from the drop‐down list box ➢ and then select an annotation group filter for grouping your pipeline runs, as shown in Figure 9.13.
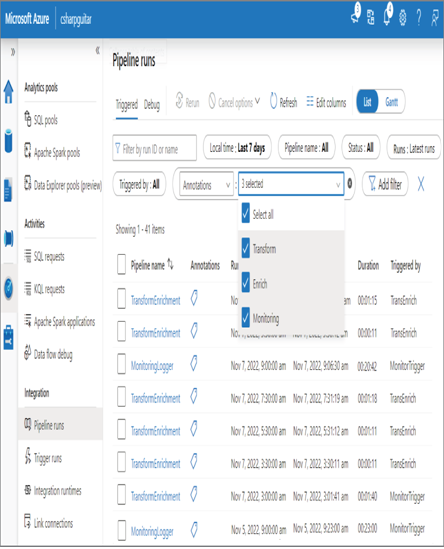
FIGURE 9.13 Azure Synapse Analytics pipeline runs filtered by annotations
- Select one of the pipeline runs from the list in the Activity Runs section. You will see a breakdown of the duration of each activity within the pipeline. If your pipeline has a Data Flow activity, hover over it and click the glasses, as shown in Figure 9.14.
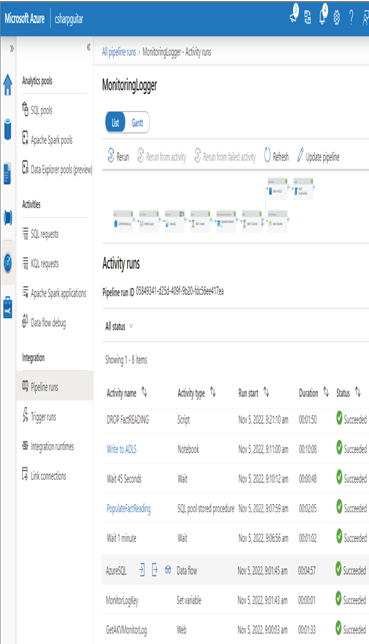
FIGURE 9.14 Azure Synapse Analytics activity runs
- The result shown in Figure 9.15 is a breakdown of data flow modifiers and their processing time.
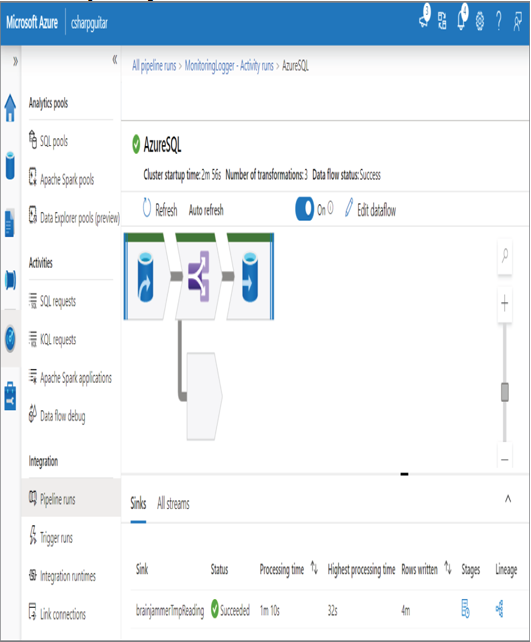
FIGURE 9.15 Azure Synapse Analytics data flow modifiers
- An activity in the pipeline executed a notebook on a Spark pool. As shown in Figure 9.14, the activity is named Write to ADLS. Click the activity name to view the log of that execution. You will see something similar to Figure 9.16.
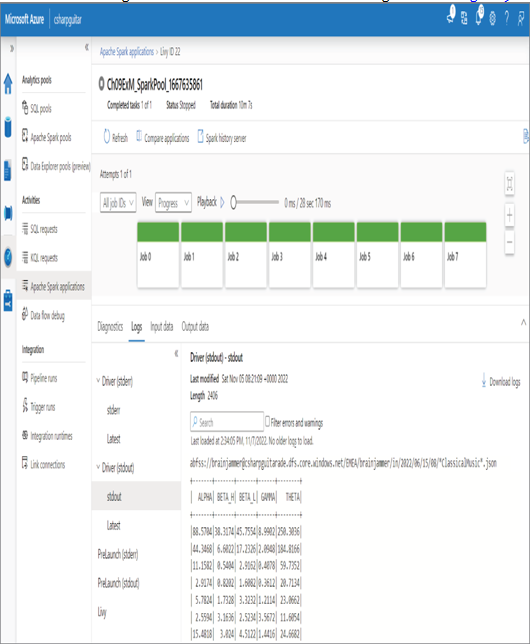
FIGURE 9.16 Azure Synapse Analytics Apache Spark applications
Exercise 9.3 is intended to provide you with steps to navigate through pipeline monitoring features available in the Azure Synapse Analytics workspace. The features depend on the pipeline and the activities that run within it; for example, you will see Data Flow and Notebook log details only if there are Data Flow and Notebook activities in the pipeline. The first step in the exercise was to add an annotation to a pipeline introduced in Chapter 6. Adding an annotation to your pipeline properties is a good habit, because it is a value that can be used to filter out or group together related runs on the Pipeline Runs page. You saw the duration value for each pipeline run, which represents the amount of time it took to complete all pipeline activities. When you select the pipeline name, you are presented with a more granular view of the activities within the pipeline and the duration on a per‐activity basis. You can drill further into the Data Flow and Notebook activities to show the amount of time per modifier. From a notebook perspective, there are stderr logs, stdout logs, and job‐by‐job details, including duration.
In addition to the monitoring capabilities within the Azure Synapse Analytics workspace, there are the standard monitoring features in the Azure portal. You will recognize them as Alerts, Metrics, Diagnostics, and Logs. The Alerts feature, in the context of an Azure Synapse Analytics workspace, provides access to conditions like what you saw in Figure 9.5 and in Exercise 9.2. Additional examples include login attempts, activity runs ended, link connection events, link latency, and trigger runs ended. The Metrics feature at the Azure Synapse Analytics workspace level are categorized into groups concerning the serverless SQL pool, for example, the amount of processed data in bytes, pipeline, linked services, and streaming. You can find greater insights into dedicated SQL or Spark pools on the respective Metrics blade.
An important point worth repeating from an exam perspective is that all monitoring tools are approached from the context and perspective of the Azure Monitor workspace. When a question about monitoring contains only Azure Monitor, but you are thinking the actual capability resides in Log Analytics or Diagnostic Settings (because they both are in the purview of Azure Monitor), then Azure Monitor is the answer to the question.


