The previous DMV functions target the SQLPool database, which means they were focused on the database. The following functions target the master database on the dedicated SQL pool, which means the results will contain data related to all databases hosted on the targeted pool. A large set of performance counters can be accessed using the DMV function named sys.dm_os_performance:counters. Execute the following to get a list of available Windows performance counters:
SELECT DISTINCT counter_name
FROM sys.dm_os_performance:counters
ORDER BY counter_name
The last DMV function to be called out is useful for monitoring database transactions like rollback, commits, save points, status, and state:
SELECT TOP 10 * FROM sys.dm_tran_database_transactions
A column named database_transaction_state will contain a number that describes the state of the transaction. Table 9.3 describes the potential numbers.
TABLE 9.3 database_transaction_state column description
| Value | Description |
| 1 | The transaction has not yet been initialized. |
| 3 | The transaction is initialized but has not generated logs. |
| 4 | The transaction has generated logs. |
| 5 | The transaction is prepared. |
| 10 | The transaction has been committed. |
| 11 | The transaction has been rolled back. |
| 12 | The transaction is being committed. |
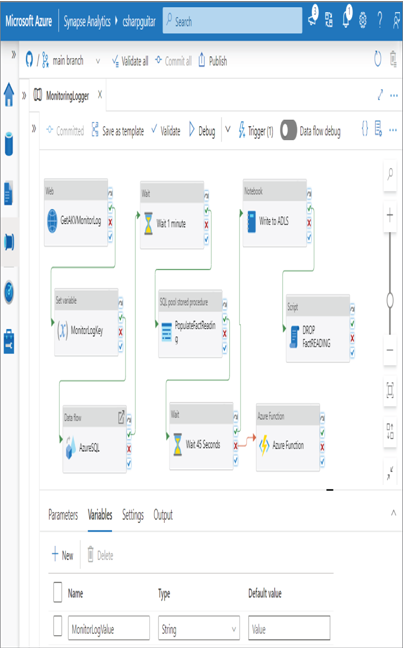
A lot of documentation about the meaning of the values in the columns returned by many of these functions is available online. You can find search for the functions at https://learn.microsoft.com. In‐depth coverage of these functions and column values is outside the scope of this book, but you do not need to know much about them for the exam. In true operational use, not only do you need to know what these column values mean, but you must also know if they represent a scenario that is considered an anomaly, which you can learn only through hands‐on experience with the application itself. There is a lot to learn in this area, requiring much experience, so keep learning and doing, starting with the Exercise 9.3. To attain insights from Exercise 9.3, there needs to be monitor log data to analyze. As you saw in Figure 9.10, the pipeline being monitored was named MonitoringLogger. This pipeline was pulled together using activities from many previous exercises and is illustrated in Figure 9.12.

FIGURE 9.12 An Azure Synapse Analytics sample pipeline to generate monitor logs
The export of the pipeline is in the Chapter09 directory on GitHub, in the file MonitoringLogger.json. It is provided to give you some idea of what was used to generate the logs in this exercise. After about a week of running the pipeline 4 times per day, every 6 hours, there was enough data to find some operational insights. You might consider creating a sample pipeline and letting it run for some time before beginning this exercise, to ensure that you have some logs to look at.


