- Log in to the Azure portal at https://portal.azure.com ➢ navigate to the Azure Synapse Analytics workspace you created in Exercise 3.3 ➢ select Alerts from the Monitoring section on the navigation pane ➢ select the + Create menu item ➢ select Alert Rule from the drop‐down menu ➢ and then select Pipeline Runs Ended from the Select a Signal window.
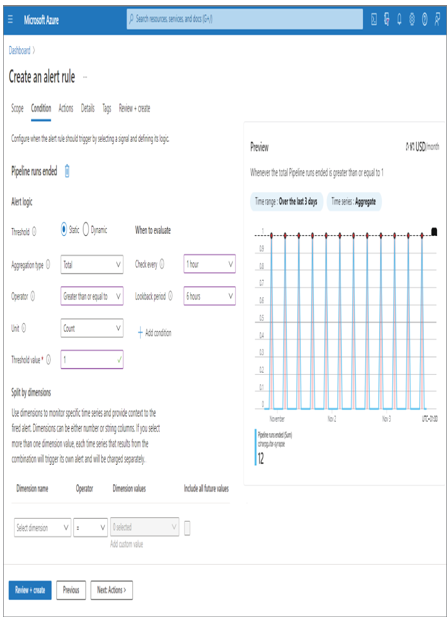
- From the Condition tab, set the Threshold to Static ➢ select Total from the Aggregation Type drop‐down list box ➢ select Greater Than or Equal To from the Operator drop‐down list box and enter 1 into the Threshold value textbox ➢ select 1 hour from the Check Every drop‐down list box ➢ and then select 6 hours from the Lookback Period drop‐down list box. The configuration should resemble Figure 9.4.

FIGURE 9.4 Creating an Azure Synapse Analytics alert condition
- Click the Next: Actions > button ➢ click the + Create Action group button ➢ select the appropriate subscription resource group ➢ select a recommended region from the Region drop‐down list box ➢ enter an Action group name (I used brainjammer) ➢ click the Next: Notifications > button ➢ select Email Azure Resource Manager Role from the Notification Type drop‐down list box ➢ select Owner from the Azure Resource Manager Role on the Email Azure Resource Manager Role pop‐up window ➢ toggle Enable the Common Alert Schema to Yes ➢ click OK ➢ enter a name (I used brainjammer Owner) ➢ click the Review + Create button ➢ and then click Create.
- Select the Next: Details > button ➢ select the appropriate subscription and resource group ➢ select Informational from the Severity option ➢ enter an alert rule name (I used brainjammerSynapsePipelineRun) ➢ enter a description ➢ click the Review + Create button ➢ and then click Create. It might take a few moments to create the alert rule, so be patient.
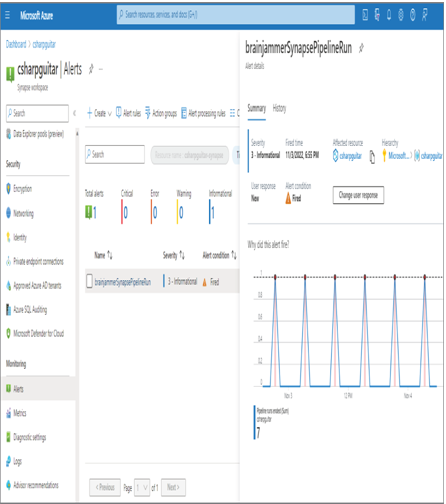
- After the alert rule has been created and executed, the Alerts blade for the Azure Synapse Analytics workspace should resemble Figure 9.5.

FIGURE 9.5 The Azure Synapse Analytics Alerts blade
Three options are available on the + Create drop‐down menu you selected in step 1: Alert Rule, Action Group, and Alert Processing Rules. In Exercise 9.2 you created both an alert rule and an action group. An alert rule is used to determine the circumstances in which an alert should be invoked. In Exercise 9.2 the condition was based on a single occurrence of the Pipeline Runs Ended event. The selected threshold was Static, which means you configured the Unit and Threshold values that will cause an alert to trigger.
The other option, Dynamic, uses machine learning algorithms that create metrics considered normal for your targeted condition. If the metrics breach what is considered normal operating behaviors, an alert is triggered. Other options such as Check Every and Lookback Period enable you to configure how often the platform checks if the condition is met and determine if an alert notification should be sent. The lookback period is the timeframe in which the data is checked according to the entry in the Check Every drop‐down.
The Details tab includes an important selection that pertains to all types of logging. The selection has to do with the verbosity and severity level of the alert. Table 9.1 provides a summary of each severity option.
TABLE 9.1 Logging verbosity and severity
| Level | Alert type | Frequency |
| 0 | Critical | Very rare |
| 1 | Error | Rare |
| 2 | Warning | Somewhat often |
| 3 | Informational | Often |
| 4 | Verbose | Always |
When configuring this setting, you need to consider the expected frequency of the notification. Critical alerts should not happen very often and should therefore be configured to notify the most skilled members of the team who can quickly react and respond to the issue. Errors occur less often than critical alerts and would have less impact, but this type is still considered a rather high level of alert. Warnings can happen often and are usually not something that you would want to call someone outside of business hours to analyze and resolve. Informational and verbose alerts would trigger often and would not need to be acted upon with a high level of urgency. Those two severity and verbosity levels are for storing historical and performance logs used for learning the common behaviors of your application.
An alert group is where you configure the notification type and who receives the notification on the Notifications tab. The options are to email members of an Azure Resource Manager Role like Owner, Contributor, Reader, Monitoring Contributor, or Monitoring Reader. The other option is to send an email, SMS, mobile app notification, or a voice message to a phone number. Multiple notifications are supported, so you can send notifications to multiple ARM roles and to numerous phone numbers, or via text messages and emails. On the Basics tab, you select a region. In addition to the Global option, a few geographical recommendations are rendered based on the proximity of the resource group. Selecting one of the recommended regions means that redundancies are contained within a single geographic boundary.
Selecting Global means that your alert redundancies span any geographic region. On the Actions tab you might have noticed that the notifications can be sent to some ingestion points or compute platforms, for example, Event Hubs, Logic App, Webhook, or an Azure Function. The alert is sent in JSON format and can be ingested or transformed using any of those technologies to store and gather insights from the data. An alert processing rule gives you a bit more control over what happens when an alert is invoked, for example, the ability to suppress notifications during times of planned maintenance and based on whether the issue is a onetime or reoccurring exception.


