- Log in to the Azure portal at https://portal.azure.com ➢ enter Azure Monitor workspace into the Search box at the top middle of the web page ➢ select it from the results ➢ click the + Create menu button ➢ enter a subscription ➢ enter a resource group ➢ enter a name (I used brainjammer) ➢ enter a region ➢ click the Review + Create button (note that Azure Monitor is not available in every region) ➢ and then click Create.
Notice the two URLs on the Overview blade of the Azure Monitor workspace. One of them, the metric ingestion endpoint, is an ingestion endpoint for the metrics that your application generates. If you use the Azure Monitor SDK to send those logs to the Azure platform, this is where you send them. The other endpoint, the query endpoint, is used for querying the data. Again, using the Azure Monitor SDK, you can create an application that retrieves and renders the metric data to a console for viewing and analysis. The custom application that uses the Azure Monitor SDK would be something like Microsoft Intune or System Center, which is a product designed to capture application, networking, and operational data, and then send it for analysis to a data source like Azure Monitor. On‐premises servers and Azure platform IaaS products like Azure Virtual Machines or Azure Kubernetes use this Azure Monitor workspace as the central hub for monitoring behaviors for those kinds of product scenarios.
It is important to call out the points in the previous paragraph because the concept of Azure Monitor is different when applied to Azure PaaS products. Azure Storage, Azure Synapse Analytics, Azure Stream Analytics, and many of the other products you have used have Azure Monitor logging capabilities built in. The products referred to in the following sentence are those found in the Azure portal in the Monitoring section. They are Alerts, Metrics, Diagnostic settings, and Logs. Keep in mind that when Azure Monitor is referred to in the context of Azure PaaS products, the meaning implies the monitoring features are contained in the Monitoring section of the Azure product. Monitoring data within these product‐based monitoring features (i.e., metrics, diagnostics settings, and logs) remains for 45 days. If you require data to be available for longer, then you must use the endpoints from Exercise 9.1 to migrate and retrieve data for analysis. The following will take a closer look into each of these common Azure Monitor features, beginning with Logs. Keep in mind that the Azure Monitor workspace is currently in preview and contains only the managed Prometheus metrics, although in the future these will contain all Azure monitoring data.
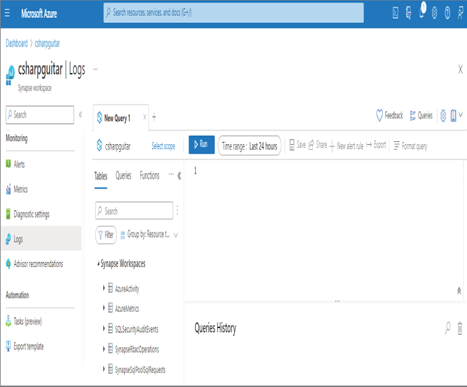
When you select the Logs navigation from any Azure product, it might look similar to what you saw in Figure 8.25. The user interface rendered on the Logs blade is the same as what you saw in the Log Analytics workspace that you provisioned in Exercise 8.4. The user interface is built on top of Azure Data Explorer, so if you have ever worked with that product, you will notice a similarity. When you select the Logs navigation link from, for example, the Azure Synapse Analytics product, you will see something like Figure 9.1. Because the context in which you opened the Logs blade is in Azure Synapse Analytics, the scope is constrained to that. If you click the Select Scope link, you can target the Kusto queries to pull data from other Azure products in your subscription.

FIGURE 9.1 The Azure Synapse Analytics Logs blade
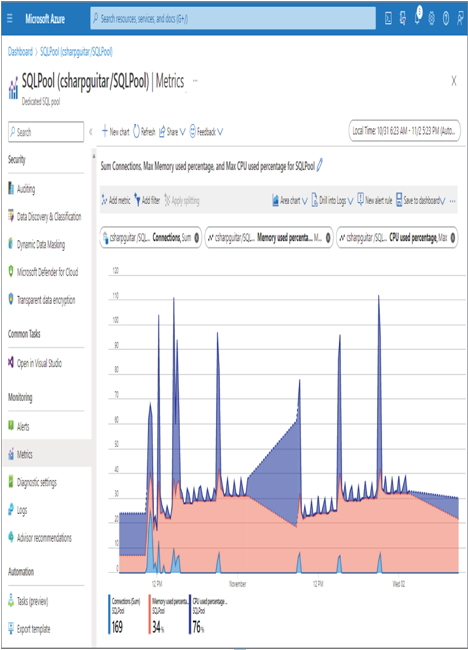
Metrics are very useful when you want to discover the amount of resources your application is consuming over a given time period, for example, how much memory or CPU, and, as shown in Figure 9.2, how many connections were made to a dedicated SQL pool. There exists a Metrics blade in the Azure portal for each product. Each product, as you might expect, will have a different set of metrics and aggregation in which they are displayed. You can use the information you gather from the metrics to determine how much the application is used.

FIGURE 9.2 Azure Synapse Analytics dedicated SQL pool metrics
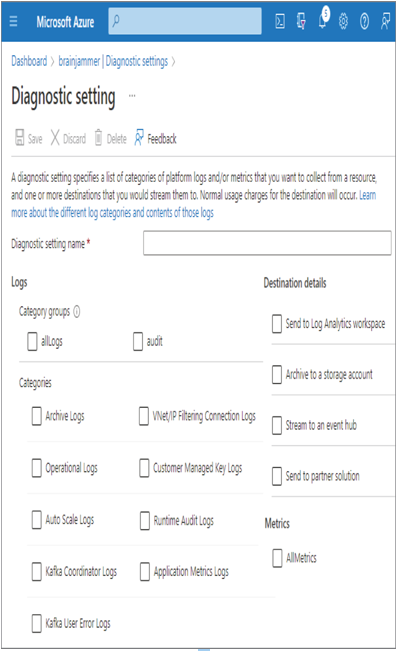
In Exercise 8.4, where you enabled auditing, you navigated to the Diagnostic Settings blade and saw the SQLSecurityAuditEvents setting that was generated automatically. You also noticed, as shown in Figure 8.24, additional log categories, including Sql Requests, Request Steps, Exec Requests, Dms Workers, and Waits. Those categories are all specific to a dedicated SQL pool. In addition to a Logs blade and Metrics blade, each Azure product also has a Diagnostic Settings blade. Figure 9.3 illustrates the Diagnostic Settings blade for an Azure Event Hub.
There are logs for monitoring incoming Kafka messages if you are using Azure Event Hubs for Kafka. Archive, Operational, Auto Scale, and Runtime logs are also available for storage into the configured destination datastore. Lastly, there is an option to store usage and performance metrics, which you saw in Figure 9.2, into a destination datastore for offline retrieval and analysis. The final monitoring feature that exists for Azure products is Alerts. As shown in Figure 9.1 and Figure 9.2, there exists an option named New Alert Rule. This option is useful when you have a Kusto query in Log Analytics or a configured metric that you want to be notified about. For example, if the Kusto query only returns errors, if a row is returned from the query, you can be alerted to that. The similar is true regarding metrics. For example, when the CPU consumption or number of connections breaches a threshold value, then an alert can be sent. Perform Exercise 9.2 to configure an Azure Synapse Analytics alert.

FIGURE 9.3 Azure Event Hub diagnostic settings


