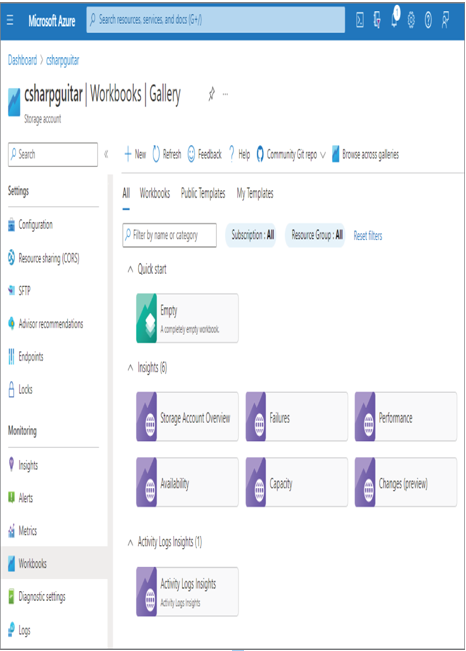
Another feature currently available to Azure storage accounts is something called Workbooks. As previously mentioned, Application Insights is an SDK that is coded into the product code, whereas the Workbooks capacity is an interface to configure the logging data published from within the Azure Storage product code. As shown in Figure 9.9, there are insights that match the tabs on the Insights blade and which you can customize to exactly what you need. You can also build a completely custom workbook that opens to a blank canvas, with options to add insights, queries, metrics, and much more.
The Alerts blade, in the context of an Azure storage account, provides access to conditions that are similar to the metrics shown in Figure 9.8—for example, availability, end‐to‐end latency, transactions, and used capacity. The Metrics blade renders options to target the storage account, blob, queue, files, or tables. The associated metrics are then grouped into two categories, capacity and transactions. Blob capacity, blob count, and blob container count are a few examples of available capacity metrics. The metrics available for the transactions category are the same as those on the Alerts blade and the Insights blade—specifically, availability, end‐to‐end latency, server latency, and transactions. Additionally, the Diagnostic Settings blade provides the option to target the account, blob, queue, table, or file feature directly. The Diagnostic Settings blade enables you to capture data from the StorageRead, StorageWrite, StorageDelete, and Transaction logs. When the diagnostic settings are configured, they are targeted to be stored in Log Analytics, and you can query those logs using Kusto queries in the Azure portal. Columns like OperationName, StatusCode, StatusText, DurationMs, ServerLatencyMs, RequestBodySize, and Uri are helpful to gather operational information about your solution.

FIGURE 9.9 Azure storage account Workbooks
The following is example of a Kusto query that will retrieve 100 of the most recent Azure Storage blob logs:
StorageBlobLogs
| project TimeGenerated, OperationName, StatusCode, StatusText, DurationMs,
ServerLatencyMs, RequestBodySize, Uri
| take 100
| order by TimeGenerated
The extracted data is also useful in case of errors or reliability issues, as the logs can be used to surface which operations failed, when, and what the operation was trying to do. (For more information about troubleshooting, see Chapter 10, “Troubleshoot Data Storage Processing.”) You do not need to directly navigate to the Log Analytics workspace you created in Exercise 8.4; instead, you can select the Logs link from the navigation menu while in the Azure storage account context. In this case, your scope is constrained to Azure Storage accounts. If you want to extract logs from different types of products using the same Log Analytics interface, then use the workspace you created in Exercise 8.4.
Azure Synapse Analytics
The DP‐203 exam includes many questions that target Azure Data Factory. Currently, most new features are being deployed into the Azure Synapse Analytics workspace, and all of the capabilities that exist in Azure Data Factory are also present in Azure Synapse Analytics, unless otherwise stated. The following content, for the purpose of the DP‐203 exam, can be used to answer questions that target Azure Synapse Analytics. Questions that are true for Azure Data Factory are also true for Azure Synapse Analytics, from an exam perspective.


