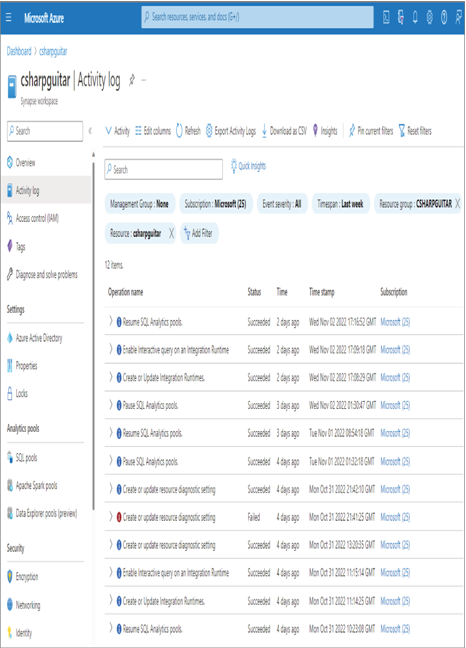
As previously mentioned, Azure products include numerous built‐in monitoring options—specifically, alerts, metrics, diagnostics settings, and logs. An additional feature is called the Azure Monitor activity log (see Figure 9.6).

FIGURE 9.6 The Azure Monitor activity log
The activity log contains operations that have been performed against the product. It does not include information about any implementation of code or the execution of jobs, queries, or pipelines that run on the product. When you select one of the entries in the log, you are prompted with a summary and a JSON document that contains complete details about the operation. One window that displays the operational details includes a + New Alert Rule button that enables you to create an alert and receive a notification when that specific operation and status occur. The following sections discuss the distinctive capabilities available for specific Azure products.
Azure Storage and Azure Data Lake Storage
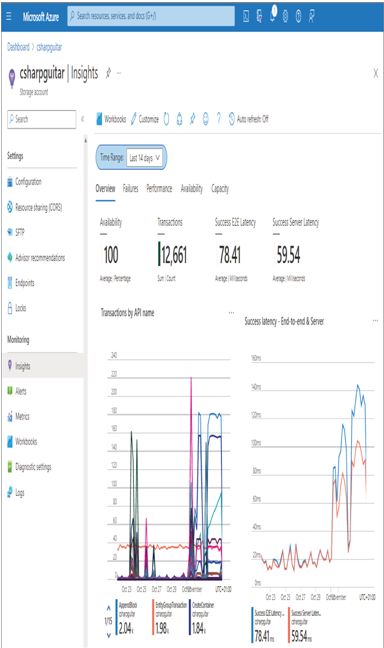
Two other monitoring features are available for an Azure storage account, in addition to the previous four already covered: Application Insights and Azure Workbooks. Application Insights is an SDK that can be included within the application code to help track down issues that happen there. The previously discussed monitoring features have been focused on the Azure platform and have targeted metrics like CPU, memory, concurrent connections, ingress, etc. The Azure Storage product is an application that executes source code to provide its service. Microsoft decided to include Application Insights in Azure Storage in order to log a more granular level of information. You can access this logging information by selecting the Insights navigation menu item, which includes the following tabs: Overview, Failures, Performance, Availability, and Capacity (see Figure 9.7).

FIGURE 9.7 The Azure Storage Account Insights Overview tab
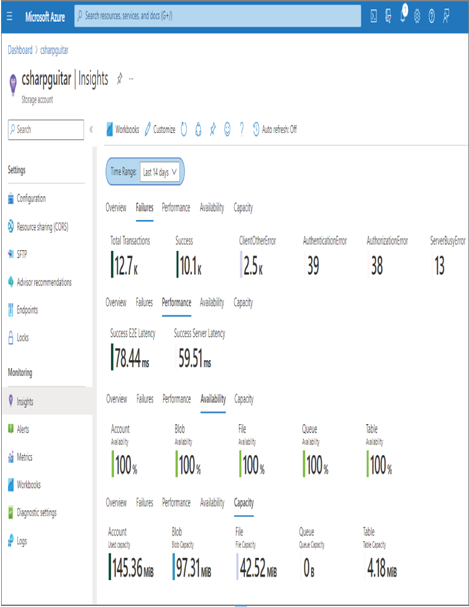
This is a very valuable feature for Azure storage accounts, because the metrics you are provided drive your knowledge deeper into the product. For example, you can see in the Transactions by API Name graph which APIs are being called the most—in this example, AppendBlock, EntityGroupTransaction, and CreateContainer. You can then research those APIs and how they may be impacting your solution. The data on the Insights blade provides just that: insights into how the Azure Storage application is being used, exposing some internals that bring you deeper into the product. The more you know about the product, the better you can then explain why certain symptoms are happening. Figure 9.8 shows a summary of the top‐level metrics from the other tabs on the Insights blade.
The Failures tab provides insights into the total number of transactions over the given timeframe, as well as a breakdown of success versus different error types. The Performance tab provides an overview of end‐to‐end latency, which measures the transaction speed between the client and the server. The amount of time spent performing the transaction on the server side is also provided. This breakdown is helpful to determine if there is poor performance on the server‐side processing or perhaps some network congestion is slowing down the operation. If you dig deeper into the Performance tab, you will find a breakdown per API name, which you learned about on the Overview tab. For example, there are performance measurements for PutBlob, ReadFile, DeleteFile, and GetBlob, which is very helpful to get very deep into the product and find specifically where any performance issue is happening. The Availability tab provides an overview of any downtime experienced by the platform or by the product itself. The Capacity tab displays the amount of space consumed by each product within the Azure storage account. Each tab provides a graphic representation of the numbers, thereby delivering a more understandable state over the given duration.

FIGURE 9.8 A summary of the Azure Storage Account Insights blade


