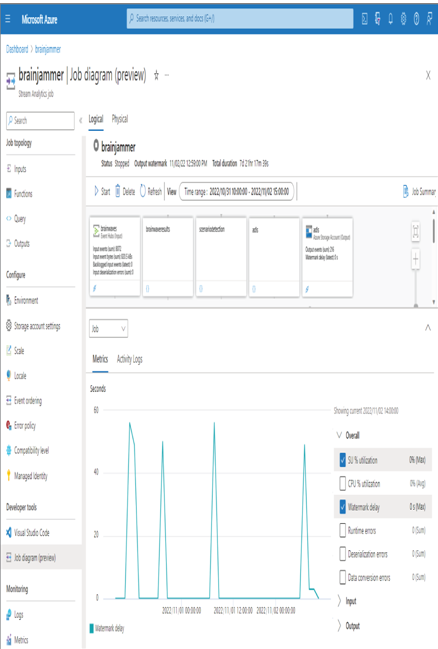
The same monitoring‐related features exist for Azure Stream Analytics as for other Azure products: alert rules, metrics, diagnostic settings, and logs. In addition to those, Azure Stream Analytics has a feature you might want to know about called the job diagram. Although this feature is currently in preview, it can give you an overall perspective of your job. As shown in Figure 9.18, you can view the input, the objects into which data is stored within the query, and the outputs. You can view numerous metrics and activity logs for the job or any of the steps that make up the job by selecting the step from the drop‐down list box that is currently set to Jobs.

FIGURE 9.18 Azure Stream Analytics job diagram
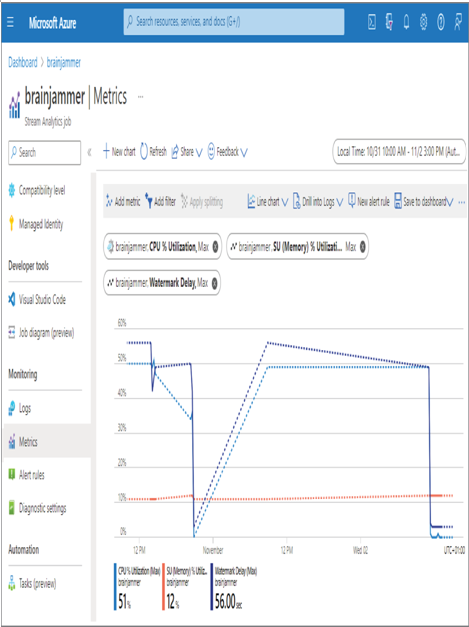
Alert rule conditions that target events for an Azure Stream Analytics job are plentiful, for example, function events, out of order events, early input events, input events, and late input events. Additionally, conditions can be triggered based on watermark delay or CPU and SU percent consumption, both of which are useful for determining if more capacity is needed. Metrics, as previously noted, provide a link directly to the Alert Rules blade, which will use the condition exposed in the configured metrics feature, as shown in Figure 9.19. Metrics are also helpful to learn how two or more metrics relate to each other. As shown in Figure 9.19, CPU % Utilization has a direct correlation with Watermark Delay.

FIGURE 9.19 The Azure Stream Analytics Metrics hub
When diagnostic settings are configured, you can log execution, authoring, and metrics into a Log Analytics workspace, storage account, event hub, or a custom third‐party solution. The storage options for diagnostic settings data are the same for all Azure products. When targeting a Log Analytics workspace, you can execute a Kusto query like the following to gather information about errors:
AzureActivity
| project TimeGenerated, CategoryValue, Level, OperationNameValue,
ActivityStatusValue, Properties
| where Level == ‘Error’
| take 100
| order by TimeGenerate
The result of this query is useful for troubleshooting any job or activity failures. Additionally, more complex queries can be run from the Log Analytics workspace directly and can be configured to span across all the products that make up your data analytics solution. If you are experiencing problems and cannot find an issue when targeting one specific product, then expanding the search to dependencies is the next step in debugging the issue.


