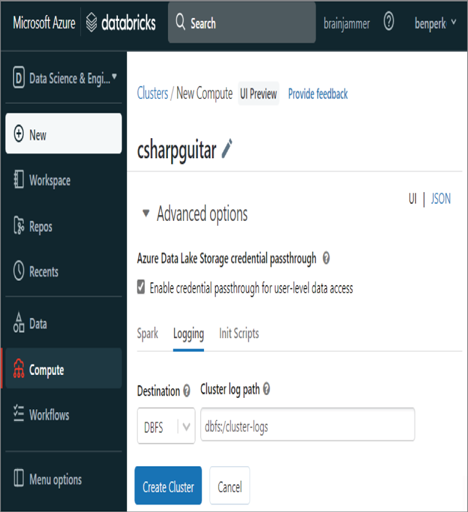
The “Azure Synapse Analytics” section described the logging of the execution of a notebook on an Apache Spark cluster (refer to Figure 9.16). In Chapter 3, Exercise 3.14, you provisioned an Apache Spark cluster that runs in the context of Azure Databricks and not Azure Synapse Analytics, although they both can use Apache Spark clusters. When you configured the Apache Spark cluster in Exercise 3.14, you might remember seeing the Logging tab within the Advanced Options section. As shown in Figure 9.20, you need to select DBFS from the Destination drop‐down list box and provide a location for the logs to be stored.

FIGURE 9.20 Azure Databricks Apache Spark cluster logging
Alert rules, Metrics, and Log do not render on the Azure Databricks page in the Azure portal. The only available monitoring feature is Diagnostic settings. Currently, 25 different categories of logs can be stored, including DatabricksClusters, DatabricksJobs, DatabricksNotebooks, DatabricksWorkspace, DatabricksPools, and DatabricksPipelines. As there is no Logs navigation item currently for Azure Databricks, you will need to navigate to the Log Analytics workspace that you configured to store the Diagnostic settings log for. The following Kusto query will provide a list of notebook operations, along with their status:
DatabricksNotebook
| project TimeGenerated, OperationName, Category, ActionName, Response
| take 100
| order by TimeGenerated
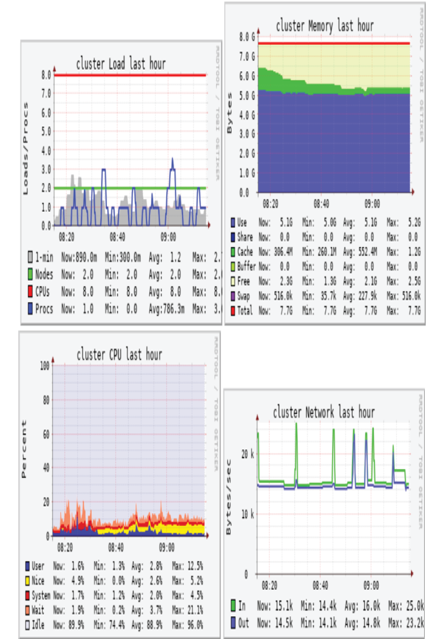
There are a few open‐source libraries you can configure to ingest Azure Databricks logs directly into Azure Monitor, for example, log4j, Azure Databricks Monitoring Library, and Dropwizard. However, the configuration and implementation of those solutions are outside the scope of this book. Finally, there is a metrics tab in the Azure Databricks workspace that resembles Figure 9.21.

FIGURE 9.21 Azure Databricks cluster metrics
The metrics are helpful to determine the consumption of CPU and memory on the cluster. There is also a metric that shows network utilization.


