The Apache Spark Applications page was discussed in Chapter 6, “Create and Manage Batch Processing and Pipelines.” Figure 6.14 illustrates the details of an invocation of a Spark notebook. The detail page provides a list of Spark sessions and batch jobs. The Spark session is the context in which the Spark notebook executes. You would expect to see the notebook name prepended to the invocation name. A batch job in this context is the platform feature that starts the Spark pool on demand. This is a great feature that saves costs because it removes the need to have your Spark pool running between pipeline runs. As a reminder, notebooks that run on Spark pools can be written in PySpark, Scala, .NET Spark (C#), Spark SQL and Spark R.
DATA FLOW DEBUG
The Data Flow Debug page renders details about active data flow debug sessions. Recall from Exercise 4.8, where you created your first data flow, the step to enable Data Flow Debug (refer to Figure 4.23). The details on this page identify who has created the debug session, how long the session will remain active, the compute type, number of allocated cores, and the bound integration runtime.
INTEGRATION
The Integration section contains information about items that typically have high concurrent connectivity with other products, features, and data sources operating in the workspace.
PIPELINE RUNS
The Pipeline Runs page (refer to Figure 9.10) is the default page when you access the Monitor hub. The page contains the name of the pipeline, the duration, what triggered it, its status, and any existing error details. This is a very helpful page to get an overview of how your pipelines are performing. When you select a pipeline run from the list, you will see details for each activity within the pipeline, for example, the activity name, type, when it started, duration, and status. If the pipeline execution is performing more slowly than expected, these details will be helpful to determine which specific activity is taking the most time.
TRIGGER RUNS
Triggers are what invoke a pipeline. In the example shown in Figure 9.10, the trigger name is MonitorTrigger, which triggers the pipeline named MonitoringLogger. Use the Trigger Runs page to gather details about the trigger type, the trigger status, and the number of pipelines it triggers for this and all the triggers on the workspace.
INTEGRATION RUNTIMES
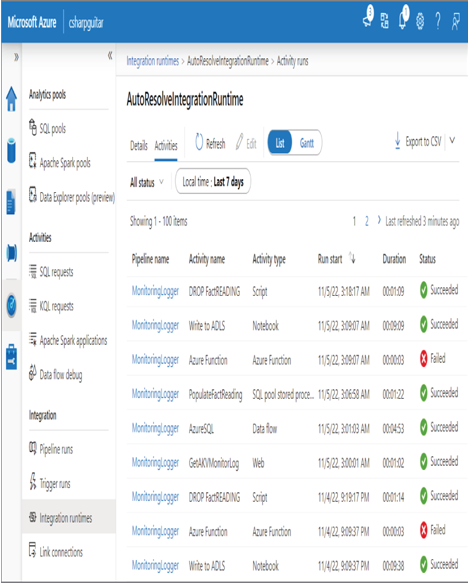
An integration runtime (IR) is a compute resource that is used to help debug, run pipelines, manage data flow, test connectivity of linked services, and run SISS packages. The Integration Runtimes page lists all your IR. Additional details about an IR are available on the Details page. As shown in Figure 9.11, you also can find valuable information from the Activities page.
The pipeline name, activity name, activity type, duration, and status are all very valuable pieces of information when you are trying to discover how your data analytics solution is performing. Failures and long‐running activities are good places to start when the solution is not running as expected.

FIGURE 9.11 Azure Synapse Analytics integration runtimes


